Rothera station is located on rocky point on the west shore of Adelaide Island. Walking around the point is a very popular way to take a break from the fish bowl life of base. I try to walk around every day.
The point is crammed with curious science and communication instruments. I have been trying to find out what the various instruments and antennae on the point do. Until today that has been achieved by me asking people who I think might know a.bout them.
Today though I found a fabulous little booklet called “Science Around the Point” that
gives a fabulous little summary of the science projects located on the Point.
Bingo, I now take this booklet along with me on my walks.
Today I stopped and looked at the second satellite dish dome that sits behind the VSAT
dome.
ARIES (Antarctic Reception of Images for Environmental Science)
Turns out this is the ARIES (Antarctic Reception of Images for Environmental Science) dome. This dish establishes connections to various polar orbiting meteorological imaging
satellites when they are within range. The satellites take high resolution images of the
region and the satellite dish here is able to receive copies of the images which are used
for weather forecasting and climate research.
The pilots and field operations teams are always eager to receive the latest images to get
an insight in the weather conditions at deep field sites they are awaiting a weather
window to visit.
Weather balloon data has been collected at Rothera station for more than 30 years, providing a valuable long term data set for climate scientists. There is an office inside the aircraft hanger where the launched instruments are stored and calibrated and a shipping container behind the hanger where the balloons are inflated and prepared for launch. Balloons are launched every Monday, Tuesday, Thursday and Friday morning by the on-duty Met Observer. Anyone on base can meet up with them at the sign-out board at 8.00am and go and help launch a balloon. On the morning I helped it was Petra on duty.
Calibrating the radiosonde
The rubber balloons are stored in a temperature controlled box in the hangar that keeps the balloons at 60c. The instrument which attaches to the balloon is called a Radiosonde, it has a GPS to track the wind speed and direction and other instruments to measure temperature, pressure and humidity. Petra calibrated the Radiosonde to the current atmospheric conditions. She then fired up the data collection software on the PC in the hangar and established a connection with the Radiosonde. She then took the instrument out onto the apron for a quick walk to be sure the GPS locations were being correctly transmitted back to the data collector.
Inflation testing weights
We then moved to the shipping container at the back of the hangar where a pallet of helium canisters are stored. Petra attached weights to the bottom of the balloon then inflated the balloon until the weights just slightly lifted from the floor. She then attached the Radiosonde to the bottom of the balloon and we rolled up the garage doors on the container and stepped outside to release the balloon.
Instruments attached
The balloon is about the size of a child sized beanbag when it is release but the rubber is not at all taut. As the balloon climbs the atmospheric pressure decreases and the volume of the balloon increases and reaches the size of a semi-trailer before it bursts and falls into the sea.
Balloon release
Once the balloon was released Petra returned to the hangar to make sure that the tracker software was receiving sensible looking data from the balloon. And job done. The data is used by Donald, the local weather forecaster here at Rothera and also sent back to the Met Office in the UK where it is used by modellers and climate scientists. The data over the past 30 years shows that the temperatures below 8km in the troposphere have warmed and that temperatures in the stratosphere have cooled. The data also shows that the warming rate at 5km above the surface are three times above the average rate of warming across the globe. Gone !
Aviation weather reports are nothing if not concise.
The benefit of this is that a large amount of information can be passed quickly. This morning I was having a flying lesson and I was listening to the radio conversations on the Cambridge Airport Approach frequency. A pilot over-flying the airport requested a METAR weather report. The controller was able to read the latest METAR to the pilot in about 20 seconds. The METAR contained the airfield identifier, date/time, surface wind speed/direction, visibility, a layered cloud report, temperature, relative humidity, barometric pressure and a significant weather report. That’s a lot of useful information passed in 20 seconds.
Here is an example of a METAR I just grabbed of the web.
It may look like gobbledygook-gook but that is jam packed with information. If you can bear it, let’s go through it one bit at a time. Explaining the format to you helps me learn, so try and pretend to listen.
Airfield Identifier (SCCI)
This is a globally unique code, every airfield is allocated an identification code by ICAO. In Europe the first letter in the code is always a E and in Great Britian the second letter is always a G. So for example Rothera is EGAR and Halley is EGAH. In South America the first letter is S and in Chile the second letter is a C. SCCI is the ICAO identifier code for Punta Arenas airport in Chile. So we know that this report is for Punta airfield.
Date/Time (2416:10Z )
The first 2 characters are the day of the month and the next 4 are the time in 24H format. The month and year are not included, they are assumed. The date/time is always in UTC which is know and Zulu time. This is what the Z at the end means. So we know from yesterdays blog post that local time in Punta is UTC-3 so this report was taken at 01:10pm local time of the 24th of September 2014(current month and year).
Wind (22002KT ) This is the wind direction in degrees magnetic (220) and the speed in knots (02). So we know that the surface wind is a gentle 2 knot wind from the South-West. Wind direction is always given in the direction that the wind is coming from.
Visibility (9999)
This is the horizontal visibility in metres. Anything over 10km is just reported as 9999 and typically read out as “all the nines” meaning more than 10km of horizontal visibility. 2000 for example would mean 2km. If a visibility is reported in miles it will be postfixed with SM for statute mile ( Eg. 3SM)
Weather
Any noteworthy current weather is mentioned in between Visibility and Cloud. This report does not include any weather codes. These are reported as 2 character long code . Some of the common codes are:
HZ – Haze
BR – Mist
FG – Fog
TS – Thunderstorm
CB – Cumulonimbus
SN – Snow
GS – Small soft hail
GR – Hail
PE – Ice pellets
IC – Ice crystals (diamond dust)
The intensity of the weather will be reported as one of the following three:
– Light
Moderate (no symbol)
+ Heavy
If there is neither a + or – then the intensity is moderate.
Cloud (SCT030 SCT200)
There are two cloud reports in this METAR which means there are two cloud layers. One low layer of scattered clouds at 3,000ft (SCT030)and a high layer of scatters cirrus at 20,000ft (SCT200). Scattered means that 3-4 oktas (eighths) of the sky is covered by the cloud layer
Temperature and Humidity (06/M01)
The first part of this section (06) tells us that the current temperature is a chilly 6 degrees Celsius at Punta. The second half (M01) is saying that the dew point is minus 1 degrees Celsius. The dew point being the temperature at which the air will become saturated. From this we know that the humidity of the air is 7 degrees away from reaching saturation point. When air reaches saturation point it releases water vapour and that makes clouds. Now very approximately the temperature drops 3 degrees for every 1000 feet of altitude gain. You can climb a big hill and check this. So if it is 6 degrees on the surface we would reckon that at about 2,300ft higher it would be -1. So 01/M01 would suggest there might be a cloud layer at about 2-3,000 feet. And hey looking back at the cloud report there is indeedy a SCT030 cloud report !
Pressure (Q0993)
This is the QNH which is a pressure measurement taken at the surface then adjusted to mean sea level to remove the airfield elevation. It is given in hector pascals and pilots can use this to calibrate their altimeters to ensure it show an accurate elevation in the current local atmospheric conditions. 1013hPa is considered a ‘normal’ QNH so 993hPa is quite low, it suggests that a low pressure system may well be in the area. So in addition to needing this to set the calibration sub-scale on their altimeters a pilot would probably also notice that it was kinda low and maybe frown.
Expected Variations or trends(NOSIG)
This section of the report highlights any expected significant variations. NOSIG means no significant trends expected in the next 2 hours. Other trend codes include:
BECMG – Becoming, meaning a permanent change is expected
TEMPO- Temporarily, meaning a temporary change lasting less than 1 hr is expected
NSW – No Significant Weather
NSC – No Significant Change
If BECMG or TEMPO are included then these will be followed by a codified message describing the change.
CAVOK
Some times the visibility, cloud report and weather section are replaced with the word CAVOK, which means ceiling and visibility OK. This substitution is only made if visibility is more than 10km, there is no cloud below 5,000ft and there is no significant weather. So CAVOK is good news for pilots hoping for conditions suitable for visual flying .
I have the perfect seat for undertaking my lessons on cloud classification. Straight out the back end of our studio I have a panoramic view of the sky and here on the Cambridgeshire Fens the clouds roll through much like they do at sea. It’s usually makes better watching than the TV.
Cloud Observation Seat
The Civil Aviation Authority and the Met Office appear to agree that there are ten types of cloud, plus a couple of bonus ones. I have been learning the two-letter codes for each of the ten cloud types and practising identifying them.
Clouds can be classified in terms of either their height or their form. The three heights are high (15,000′ to 30,000′), middle(6,000-15,000′) and low(below 6,000′). And the four forms of cloud are cirriform (fairy floss), cumuloform (cotton wool), stratiform(blanket) & nimbus (rain).
There are three high level clouds with a height between 15,000 and 30,000 feet to learn.
Ci – Cirrus clouds are whispy, silky, ghosty clouds high in the sky. Because they are so high in the sky they are made of ice crystals so tend to look very white. The height is high and the form is cirriform.
Cc – Cirrocumulus clouds are a bubbly semi-transparent film high in the sky. The film will typically be pocked, bubbled or rippled. The height is high and the form is cumuliform.
Cs – CirroStatus clouds are very high hazy, flat featureless blanket. The sun is usually visible through the film as a disk with a red fringed halo. The height is high and the form is stratiform.
There are two middle level clouds between 6,000 and 15,000 feet to learn.
Ac – Altocumulus clouds are like sheets of cotton wool balls fairly high in the sky. They tend to run in lines or waves. The globs may be separated or touching. The height is medium and the form is cumuliform.
As – Altostratus clouds are uniform blanket of greyish or bluish sheet, very slightly transparent usually enough to see the sun as a fuzzy bright white disc through. The height is medium and the form is stratiform.
There are 5 low level cloud types below 6,000 feet to learn.
Ns – Nimbostratus clouds appear as a darkish grey blanket covering the whole sky and thick enough to hide the sun. They are rain bearing. It may be a middle or low height cloud and the form is stratiform.
Sc – Stratocumulus clouds are a white or greyish sheet of lumps or rolls. Showery snow or rain may be associated with these clouds. These are what I see out my window today. They are a low level cloud that are cumuliform clouds that have formed into a stratus blanket.
St – Stratus clouds are the classic low greyish blanket so common in England. These clouds often produce a light drizzle of rain or snow. The height is low and the form is stratiform.
Cu – Cumulus clouds are the glamour cloud and most peoples favourite cloud. They are fluffy heaps sometimes with a greyish base. Typically cauliflower-shaped but your imagination is the only limit. The height is low and the form is cumuliform.
Cb – Cumulonimbus are high towering storm clouds and are a danger to aviation. Lightening, thunderstorms and hail are usually near these clouds. The height of the base of the cloud is low but the tower may extend high and the form is cumuliform.
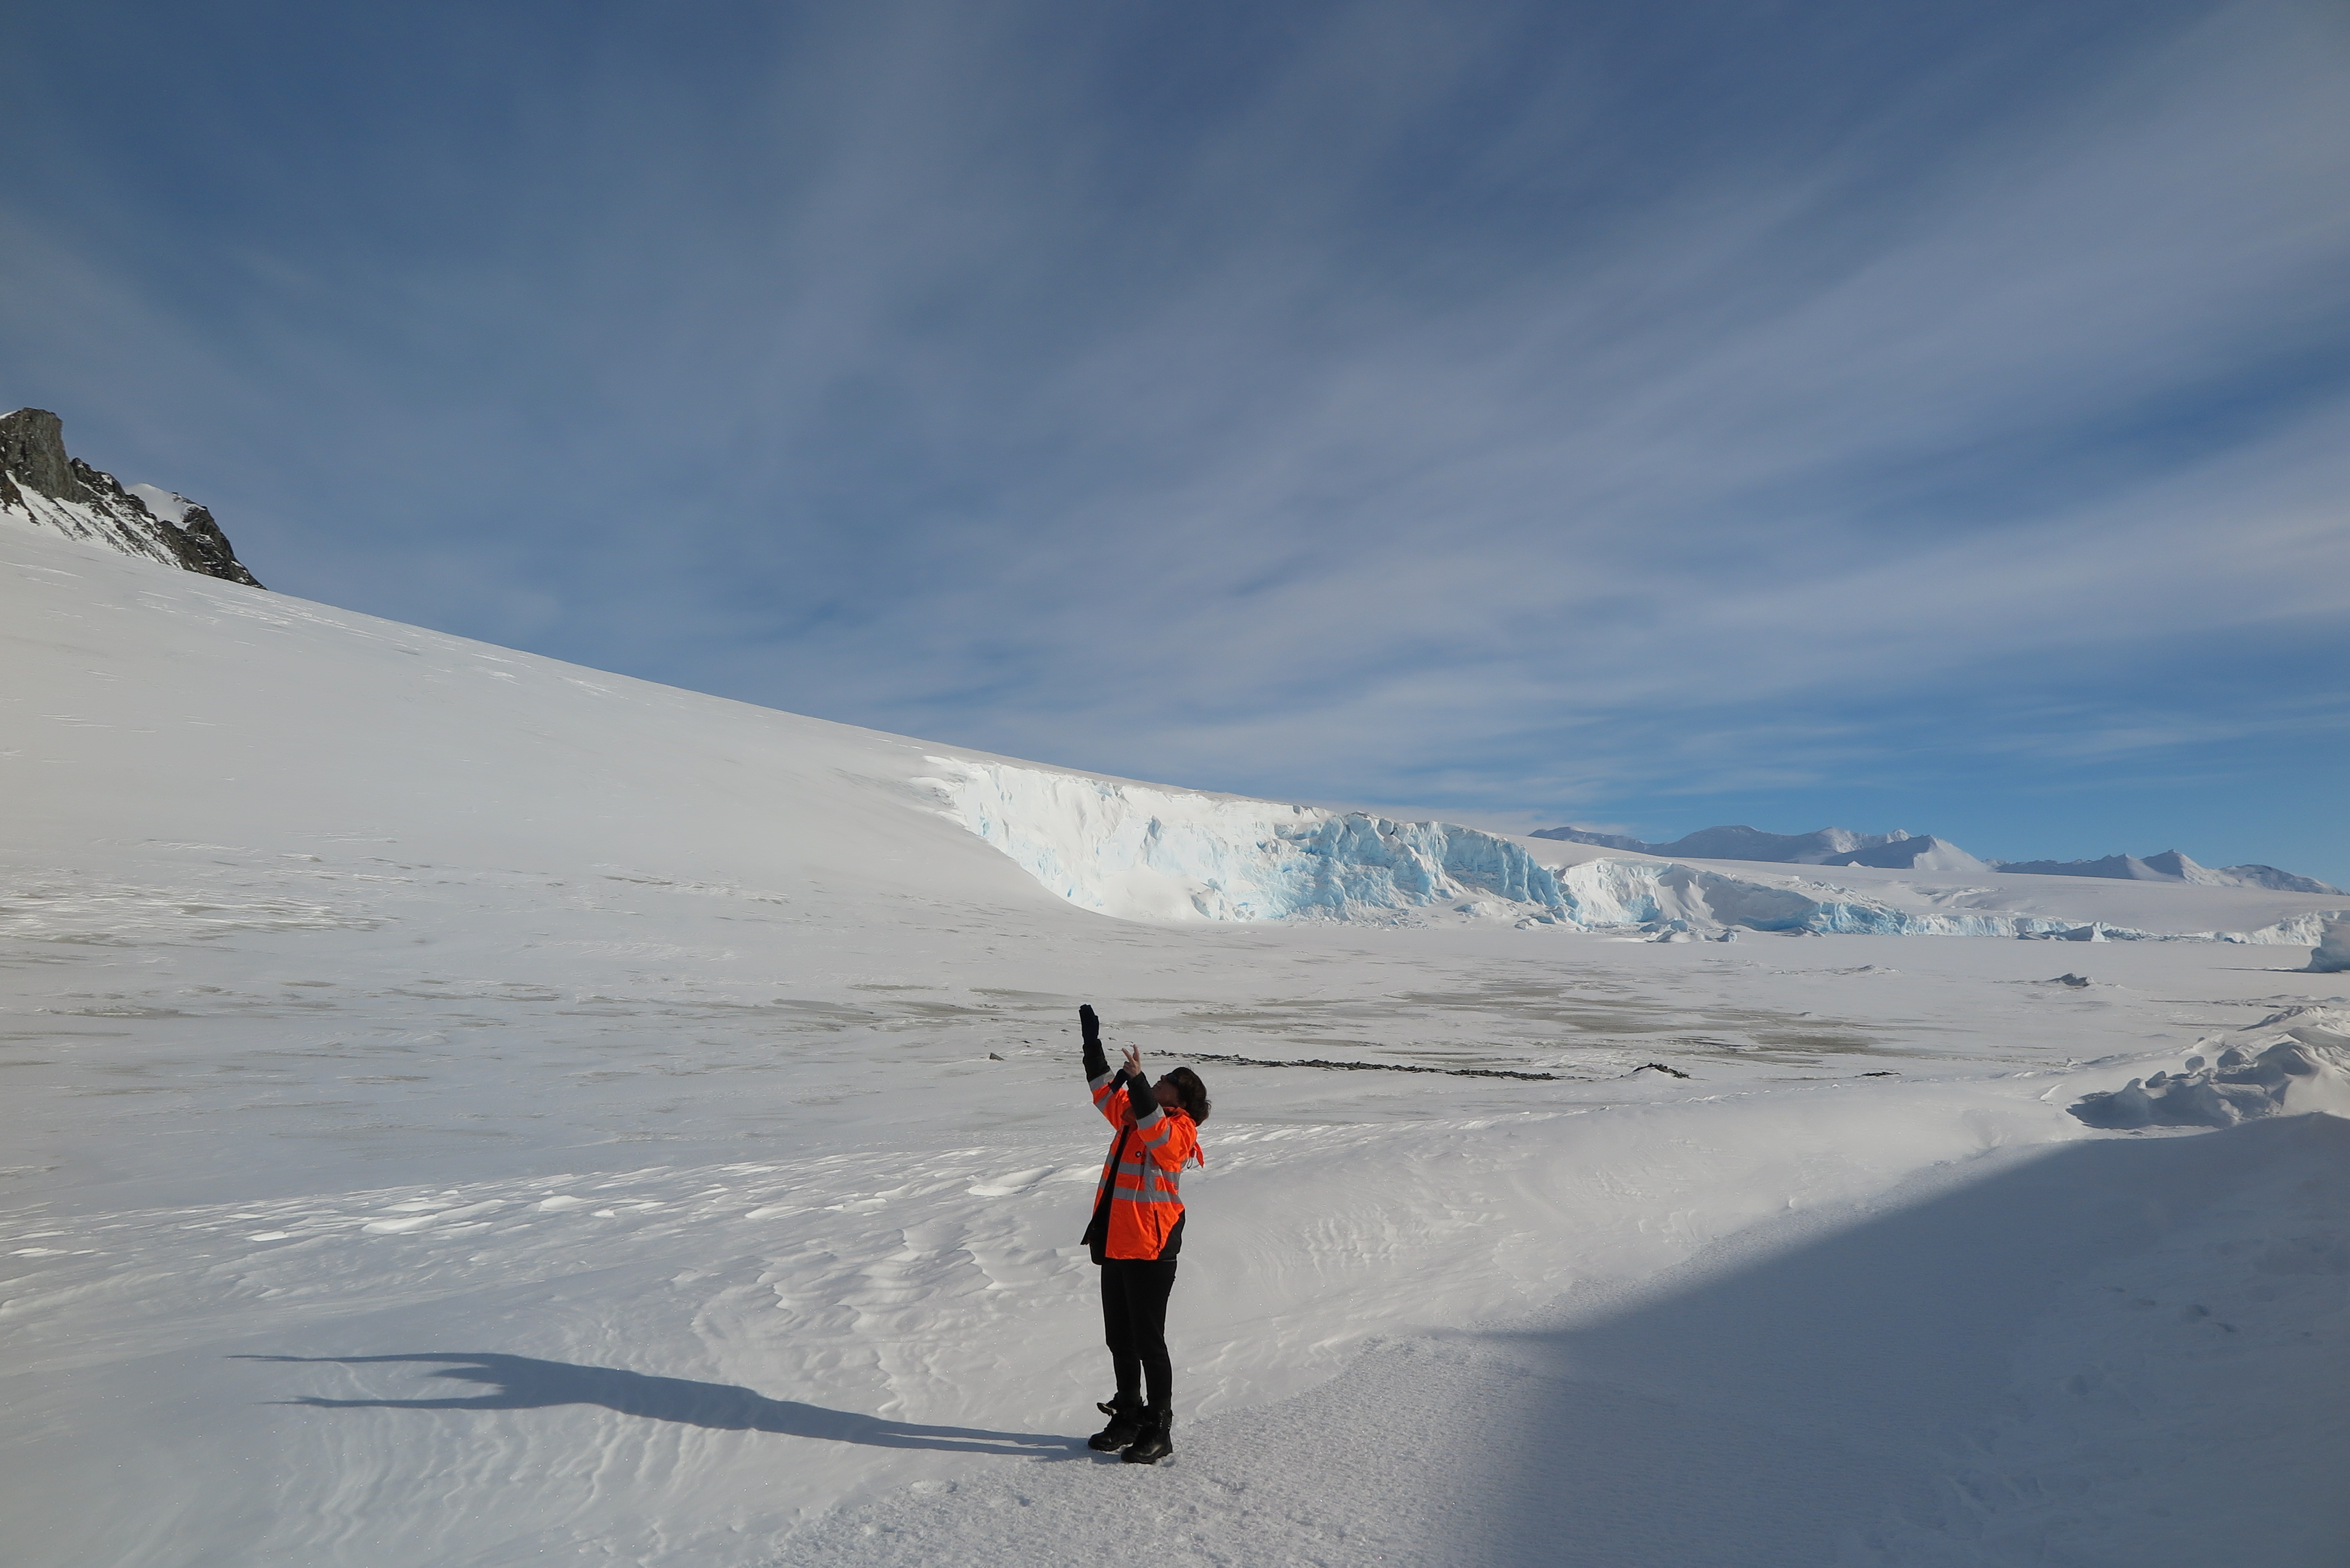
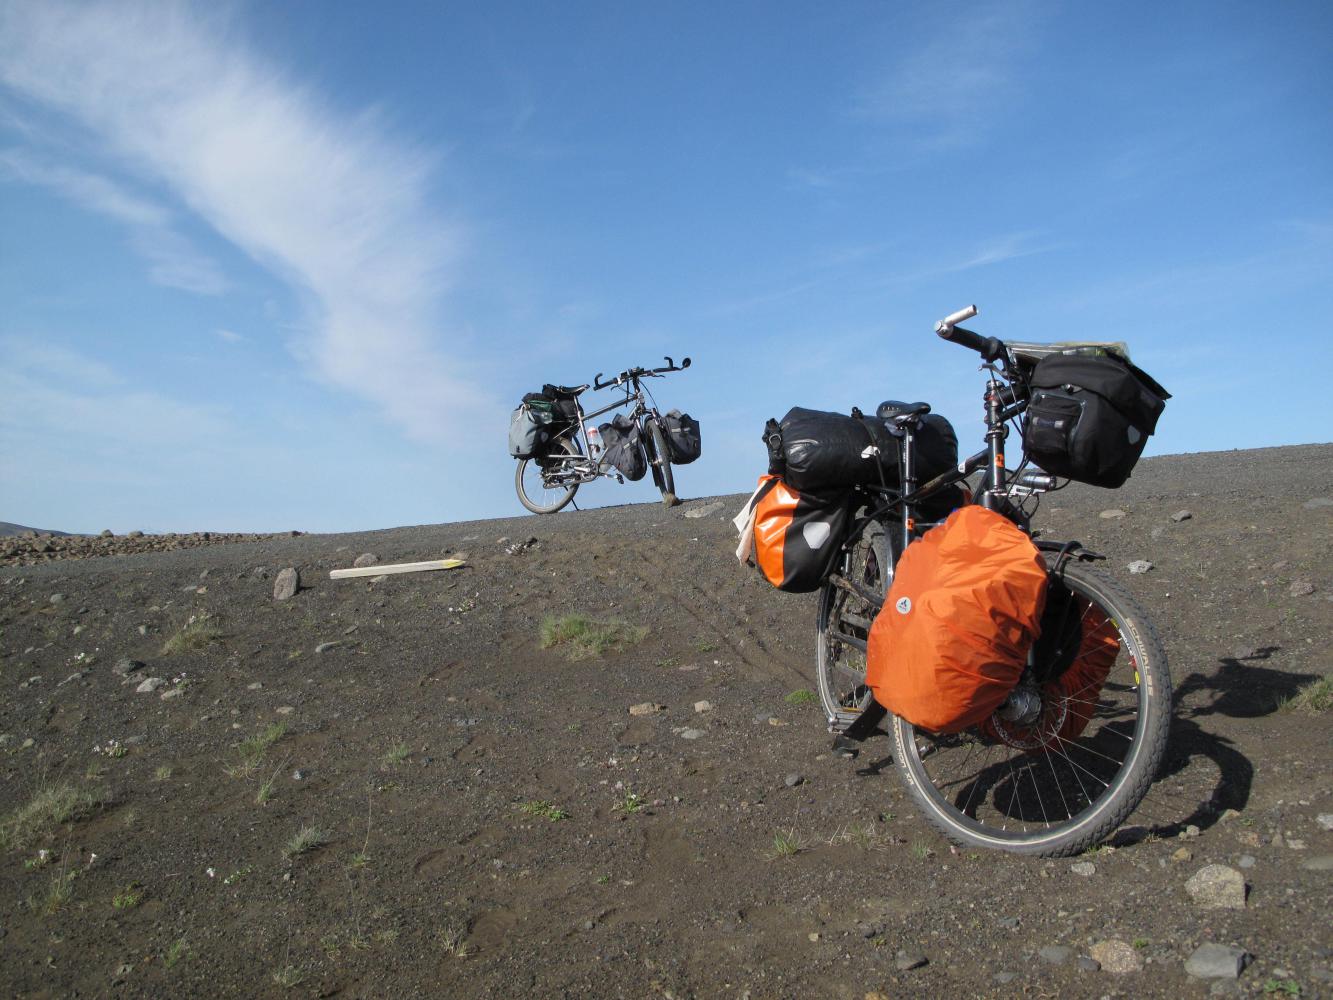
Lenticular clouds also need to be mentioned. Lenticular Ac – Lenticular Altocumulus are smooth, individual, almond-shaped clouds that form over mountains. We saw lots of these as we cycled along the Andes in Argentina and know that the are associated with very strong winds.
The cloud example images above are mostly from the Met Office training website so can’t be argued with. Below are some of my own photos that I have tried to classify, so please do to disagree if you think I have classified any of these wrongly.
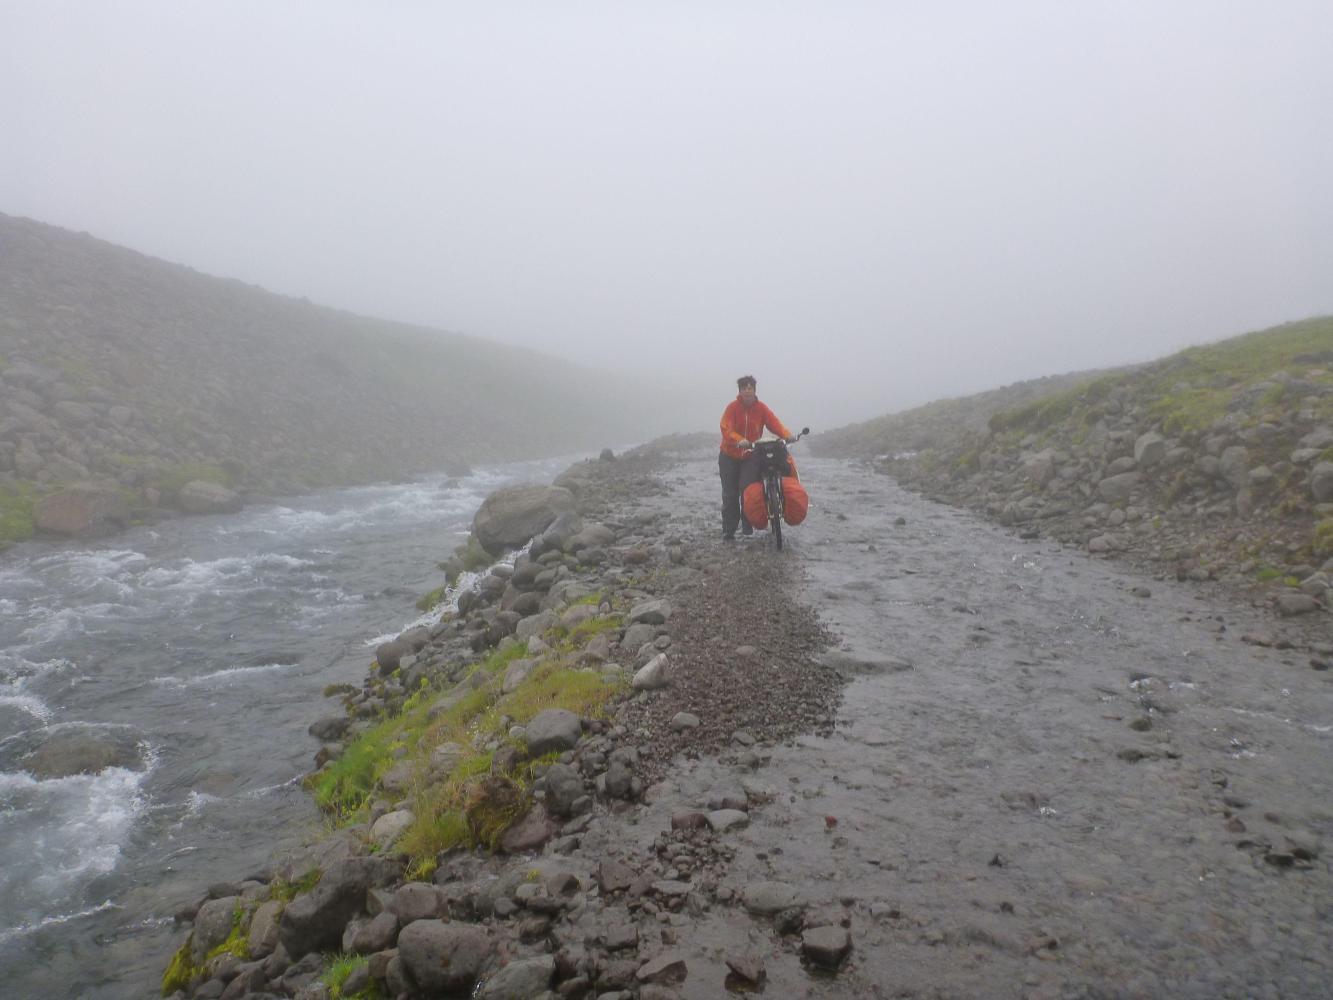
NS Nimbostratus in IcelandSc Stratocumulus ? at Wicken FenCi Cirrus ? Central Iceland again.More Ci Cirrus in IcelandSt Stratus ? In PatagoniaCB Cumulonimbus ? In Bolivia